


Abstract
Alzheimer's disease (AD) is the most prevalent form of age-related neurodementia. The accumulation of β-amyloid polypeptide (Aβ) in brain is generally believed to be a key event in AD. The recent discovery of physiological β-amyloid autoantibodies represents a promising perspective for treatment and early diagnosis of AD. The mechanisms by which natural β-amyloid autoantibodies prevent neurodegeneration are currently unknown. The aim of the present study was to analyze the N-linked glycosylation of a plaque-specific, monoclonal antibody (clone 6E10) relevant for immunotherapy of AD, in comparison with the glycosylation pattern of an Aβ autoantibody isolated from an IgG source. Liquid chromatography in combination with tandem mass spectrometry was used to analyze the glycopeptides generated by enzymatic degradation of the antibodies reduced and alkylated heavy chains. The oligosaccharide pattern of the 6E10 antibody shows primarily core-fucosylated biantennary complex structures and, to a low extent, tri- and tetragalactosyl glycoforms, with or without terminal sialic acids. The glycans associated with the serum anti-Aβ autoantibodies are of the complex, biantennary-type, fucosylated at the first N-acetyl glucosamine residue of the trimannosyl chitobiose core and contain zero to two galactose residues, and zero to one terminal sialic acid, with or without bisecting N-acetyl glucosamine. Glycosylation analysis of the Aβ-autoantibody performed at the peptide level revealed all four human IgG subclasses, with IgG1 and IgG2 as the dominant subclasses.
Introduction
As the life expectancy of individuals has continued to increase, there has been a concomitant increase in the diagnosis of diseases primarily associated with appearance late in life. Age-related dementia is a major category of such diseases and Alzheimer's disease (AD) is one of the most widely known neurodegenerative diseases. The increased life span beyond the seventh decade has promoted AD to a leading cause of death in the United States and Europe. The major pathophysiological feature of AD consists of neuronal loss, deposition of amyloid plaques, and neurofibrillary tangles (Torreilles and Touchon 2002; Weiner and Frenkel 2006). Amyloid-β polypeptide (Aβ) is the major constituent of the extracellular protein aggregates and has a central role in initiating neurodegeneration and neuronal death (Maccioni et al. 2001; Selkoe 2001; Checler and Vincent 2002; Hardy and Selkoe 2002; Parihar and Hemnani 2004; Octave 2005).
Over the past decade, Aβ has been the target of numerous therapeutic approaches, including immune therapy (Monsonego and Weiner 2003; Gelinas et al. 2004; Schenk et al. 2005; Weksler et al. 2005; Vasilevko and Cribbs 2006). Therapeutically active antibodies produced by active immunization with protofibrillar Aβ (1–42) were found to reduce the amyloid burden and to restore cognitive functions in TgCRND8 transgenic mouse models (McLaurin et al. 2002). These antibodies against Aβ in the immunized TgCRND8 mice recognize with high specificity a short epitope located at the N-terminus of β-amyloid (FRHDSGY), as demonstrated by epitope excision and high resolution FTICR MS (McLaurin et al. 2002). A therapeutic trial of immunization with Aβ (1–42) in humans had to be discontinued because a few patients developed significant meningo-encephalitic cellular inflammatory reactions (Check 2002; Orgogozo et al. 2003). Recently, a mouse monoclonal antibody (clone 6E10), derived from active immunization of mice with a synthetic amyloid peptide, corresponding to the region 1–17 of the full-length β-amyloid (1–40), has been extensively used in AD research. Terai and co-workers used the 6E10 antibody to characterize the major β-amyloid species in senile plaques by affinity – MS and immunochemistry (Terai et al. 2001), while Maddalena et al. (2004) used protein chip technology to capture the Aβ peptides in cerebrospinal fluid (CSF) with 6E10 followed by mass spectrometric characterization of the captured peptides. Other groups used 6E10 to show that monocytes in human circulating peripheral blood display surface reactivity for β-amyloid precursor protein (β-APP) (Jung et al. 1999). In cell cultures derived post-mortem from AD patients, administration of 6E10 enhanced microglial chemotaxis and phagocytosis of Aβ, and stimulated secretion of pro-inflammatory cytokines TNF-α and IL-6 (Strohmeyer et al. 2005). All these results reinforce the therapeutic potential of this antibody. A mouse monoclonal antibody 6E10 is a commercially available product, derived from active immunization of mice with a synthetic amyloid peptide, corresponding to the region 1–17 of the full-length β-amyloid (1–40). We showed, using epitope excision – FTICR MS and alanine-mutagenesis experiments, that the 6E10 antibody is plaque-specific and recognizes the same short epitope (FRHDSGY) at the N-terminus of Aβ, as did the antibodies resulting from active immunization of transgenic mice (Tian et al. 2005).
The recent discovery of anti-Aβ autoantibodies in the circulating system of healthy individuals (Gaskin et al. 1993; Xu and Gaskin 1997; Dodel et al. 2002) represents a highly promising avenue for the early diagnosis and prevention of Alzheimer's disease. Preliminary clinical results with intravenous immunoglobulins (IVIg) containing naturally occurring anti-Aβ autoantibodies demonstrated the therapeutic potential of IVIg to inhibit and/or resolve plaques (Dodel et al. 2002, 2004), as these autoantibodies might contribute to peripheral and central degradation of Aβ and to inhibition of plaque formation (Dodel et al. 2003); however, the mechanisms underlying these effects are unknown. As considerable levels of Aβ autoantibodies were found in the plasma of healthy adults (Du et al. 2001; Weksler et al. 2002; Moir et al. 2005), it is believed that they may prevent neurodegeneration and Aβ-induced neuropathology. The epitope recognized by anti-Aβ autoantibodies from commercial immunoglobulins and human serum of healthy individuals and AD patients has been recently elucidated using epitope excision mass spectrometry, showing that the antibodies specifically target a C-terminal epitope of Aβ (Przybylski et al. 2007, 2008). A schematic representation of the N-terminal, “plaque-specific” compared to the “plaque-protective” epitope is shown in Figure 1.
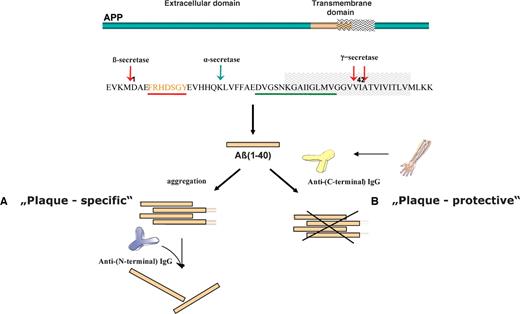
Schematic representation showing the formation of amyloid-β polypeptide from the APP precursor protein and the epitope specificities of plaque-specific (highlighted in red) versus plaque-protective (highlighted in green) anti-β-amyloid antibodies; (A) plaque-specific antibodies formed after active immunization are able to resolve the β-amyloid plaques in the brain of AD patients; (B) physiologic, plaque-protective Aβ autoantibodies prevent the accumulation of β-amyloid in the brain of healthy individuals.
One of the characteristics of immunoglobulins is glycosylation of a conserved Asn residue in the CH2 domain of the heavy chain constant region – one of the sources of molecular heterogeneity in antibodies. Each heavy chain contains one glycan moiety. The sugars attached at this conserved Asn residue from the Fc region are essential components required for high-affinity receptor binding, representing one of the pathways developed during the immune response (Ravetch and Kinet 1991; Jefferis and Lund 2002). In addition, glycans help stabilize the immunoglobulin fold by making contacts with residues on the protein backbone and with each other within the same molecule (Deisenhofer et al. 1976, 1981; Huber et al. 1976; Jefferis and Lund 2002). Complete N-deglycosylation of IgG results in the loss of binding to specific cell surface receptors (Tao and Morrison 1989; Sarmay et al. 1992; Jefferis et al. 1998) and, consequently, to a failure in the initiation of the corresponding effector functions (Burton and Woof 1992). Aberrant glycosylation of the antibody heavy chain is related to diseases, such as myeloma (Mizuochi et al. 1982; Takahashi et al. 1987) or rheumatoid arthritis (RA), thought to be caused by elevated levels of agalactosyl glycoforms. The glycoforms in RA may become antigenic and lead to formation of antibody–antibody immune complexes (Parekh et al. 1985). The N-linked glycans on the heavy chains have been extensively characterized and consist of the biantennary, complex-type around the trimannosyl chitiobiose core (Mizuochi et al. 1987; Takahashi et al. 1987; Jefferis et al. 1990). It has also been shown that normal human IgGs contain predominantly core fucosylated structures, elongated on each arm with N-acetyl glucosamine (GlcNAc) and with variable amounts of galactose, sialic acid, and bisecting GlcNAc (Jefferis et al. 1990).
Since the 1990s, mass spectrometry (MS) using electrospray (ESI) or matrix-assisted laser desorption ionization (MALDI) has become increasingly valuable for structural characterization of biomolecules and their posttranslational modifications. The main advantages of MS are high sensitivity, accuracy, speed, and applicability to mixtures. No other analytical technique can match MS for the range of structural problems that can be addressed, the complexity of the samples that can be analyzed successfully, and the quantity of information that can be obtained from sub-nanomolar amounts of material. Glycosylation analysis is recognized as one of the current challenges in proteomics (Reinders et al. 2004) and liquid chromatography–mass spectrometry (LC/MS) has become an invaluable technology for the analysis of protein glycosylation. Accurate information about the N-linked sugars on a protein can be obtained by analyzing either the carbohydrates or the glycopeptides derived from different enzymatic procedures (Wuhrer et al. 2005, 2007). Glycopeptides frequently constitute only a minor fraction of a complex peptide mixture, e.g., a tryptic digest of a glycoprotein preparation, so that differentiation between glycosylated and non-glycosylated peptides prior or during LC/MS analysis is essential. This can be achieved either by using lectin affinity enrichment prior to LC separation (Kaji et al. 2003; Hirabayashi 2004) or by scanning characteristic sugar oxonium ions (e.g., m/z 204.1, protonated N-acetylhexosamine or m/z 366.1, protonated HexHexNAc) arising during an MS/MS experiment or from in-source decay in the MS mode, after elution from the column (Itoh et al. 2002; Ritchie et al. 2002; Wang et al. 2003; Sullivan et al. 2004).
In the present study, we investigated the N-linked glycosylation of two epitope – specific anti-β-amyloid antibodies. The molecular heterogeneity of the sugars present at the N-linked site of the mouse monoclonal anti-Aβ (1–17) antibody and polyclonal serum Aβ autoantibodies was revealed from the analysis of the heavy chain glycopeptides by LC-MS/MS. Glycopeptide analysis provided a detailed picture of the carbohydrates decorating the immunoglobulin constant region and of the IgG subclasses present in the polyclonal Aβ autoantibodies. Using this approach, it was possible to determine the microheterogeneity of the glycan populations within each IgG subclass and to compare this pattern with the total human IgG fraction.
Results and discussion
Structural features of IgG glycosylation
Glycosylation of the Fc-region represents an important feature of immunoglobulins, with impact on antibody-receptor recognition (Ravetch and Kinet 1991; Jefferis and Lund 2002). In the present study, we elucidated the heavy chain N-linked glycosylation of two epitope-specific anti-β-amyloid antibodies, which might become relevant for understanding the pathophysiologic role of these antibodies in AD. The 6E10 monoclonal antibody was derived from active immunization of mice with Aβ (1–17) fragment, whereas the polyclonal Aβ autoantibody was isolated from serum immunoglobulin preparations using an immobilized Cys-Aβ (12–40) affinity column. The epitope specificity of these antibodies (see Figure 1) was determined using epitope excision and high-resolution MALDI-FTICR mass spectrometry (Przybylski et al. 2007, 2008). The profiles of the N-linked glycans from the antibody constant region were determined from the LC/MS analysis of the glycopeptides formed by in-gel digestion of reduced and alkylated heavy chain band (50 kDa). Selective detection of tryptic glycopeptides eluted from the HPLC column was performed using the parent ion detection method (PID) (Huddleston et al. 1993; Ritchie et al. 2002). This mass spectrometric approach has the advantage that specific sugar oxonium ions such as protonated N-acetyl glucosamine (GlcNAc+, m/z 204.1) or HexHexNAc+ (m/z 366.1) are generated during data-dependent acquisition, and those ions can be monitored by extracted ion chromatograms (EIC), enabling detection of glycopeptides in enzymatic mixtures containing both peptides and glycopeptides, without enrichment of the sugar containing species.
The N-linked glycans at the conserved constant region Asn residue on the immunoglobulin heavy chain have been extensively characterized and found to be of the biantennary, complex-type attached to the trimannosyl chitobiose core (Dwek et al. 1995). It was shown that human IgGs contain high amounts of α(1,6) core fucose (F), with minimal amount of N-acetyl neuraminic acid (SA) and bisecting GlcNAc (B) (Dwek et al. 1995) while mouse IgGs contain N-glycolyl neuramic acid (NeuGc) instead of N-acetyl neuraminic acid. The physiological IgG glycans have zero to one core fucose units and zero to two galactose residues, Gn (n = 0, 1, or 2). For example, the notation G1FBSA refers to a complex, core fucosylated biantennary glycan containing bisecting GlcNAc, a single β (1–4) galactose and a single sialic acid unit, while the notation G2 indicates a complex-type glycan bearing two β-linked galactose residues (one on each antennae of the trimannosyl chitobiose core) without core fucosylation.
Glycopeptide analysis of the plaque-specific, mouse monoclonal antibody 6E10
The plaque-specific, mouse monoclonal antibody (clone 6E10) belongs to the IgG1 immunoglobulin subclass and the corresponding tryptic peptide containing the consensus sequence for N-glycosylation is EEQF297NSTFR. The (+)ESI-MS/MS spectrum of the doubly charged precursor ion of m/z 1301.53 is presented in Figure 2A, confirming the G0F glycan structure assigned for this mass and the identity of the tryptic peptide containing the glycan. The MS/MS experiments revealed two different fragmentation pathways: (i) neutral loss of the sugar moieties from the nonreducing end of the glycan, which generated doubly protonated fragments (marked with an asterisk in the spectrum) with an intact peptide backbone and (ii) charge reduction of the precursor, which produced protonated sugar oxonium ions with a single positive charge and singly charged glycopeptide ions containing the remaining sugar residues. The MS/MS spectra of glycopeptides are characterized by abundant fragment ions derived from one of the two fragmentation pathways described above and by low abundance or no backbone fragments. However, a low abundant b7 fragment formed by peptide backbone cleavage which still has the first GlcNAc unit attached at the Asn residue was observed at m/z 1039.42 (see Figure 2B) consistent with the amino acid sequence of the peptide. In addition, complete processing of the glycan from the nonreducing end resulted in a peptide fragment of m/z 1157.57, which was assigned as the singly protonated peptide.
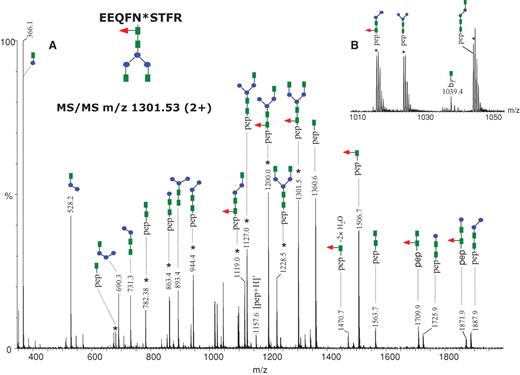
MS/MS of the precursor ion of m/z 1301.53 (2+) corresponding to the glycopeptide EEQFN*STFR, containing the glycan indicated at the top (left). Doubly charged ions are highlighted with an asterisk. The remaining ions are singly charged. (A) The MS/MS spectrum obtained in the data-dependent mode using a collision energy gradient from 30 to 40 V, showing all the observed fragment ions. (B) The inset in the mass range m/z 1010–1050 indicates the singly charged ion at m/z 1039.4 which arises from backbone cleavage and carries an N-acetylglucosamine residue. Color code: green square – N-acetylglucosamine; red triangle – fucose; blue circle – mannose; yellow circle– galactose; purple rhombus – sialic acid.
The mass spectrum averaged over the chromatographic retention time in which the glycopeptides eluted is presented in Figure 3A. The most abundant species, detected in the positive ion mode as doubly protonated fragments of m/z 1301.53, 1382.55, and 1463.60, were assigned to the glycoforms G0F, G1F, and G2F, respectively. The structural assignment of the N-glycans was deduced from the difference between the experimental glycopeptide mass observed and the calculated mass of the tryptic peptide without the sugar moiety (EEQFNSTFR, Mr 1156.6), consistent with the structural information provided by MS/MS (Figure 2). The low abundance nonfucosylated structures G0, G1, and G2 were detected as doubly charged fragments of m/z 1228.52, 1309.53, and 1390.55. This pattern is consistent with the structures reported for recombinant monoclonal antibodies (Sullivan et al. 2004).
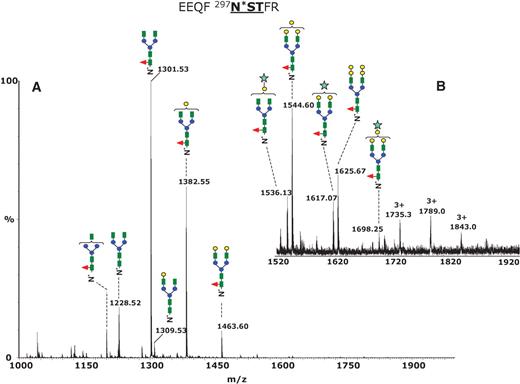
Positive ion nHPLC/ESI/MS of the Fc glycopeptides EEQFN*STFR from the mouse monoclonal antibody 6E10. (A) The MS spectrum averaged over the chromatographic window where glycopeptides eluted (30.6 min, average of 15 full MS scans). The glycan structures of the most abundant glycoforms are indicated above each ion. All ions are doubly charged. (B) Inset in the mass range m/z 1520–1920, showing low abundance di-, tri-, and tetragalactosylated glycoforms. The triply charged ions of m/z 1735.0, 1789.0, and 1843.0 show unusual oligosaccharide composition (see Discussion in the text). Color code: green square – N-acetylglucosamine; red triangle – fucose; blue circle – mannose; yellow circle – galactose; light blue star – N-glycolyl neuraminic acid.
The expanded mass range m/z 1500–1920 presented in Figure 3B shows two low abundance glycoforms detected as doubly charged fragments of m/z 1544.60 and 1625.67, which were assigned to core fucosylated, biantennary, complex-type glycans incorporating three and four galactose residues, respectively, whereas the third and the fourth galactose units are probably α(1,3)-linked to the Gal-β(1,4)-GlcNAc. Hypergalactosylation of recombinant immunoglobulins was reported previously for antibodies expressed in NS0 cell lines (Sheeley et al. 1997), and this feature represents a potential problem if such a monoclonal antibody should be used as a therapeutic agent due to the possible immunogenicity. It has been reported that up to 1% of the circulating IgG may be specific for binding the α-Gal epitope (Galili 1993) and that antibodies containing this motif might be highly immunogenic. This may lead to increased degradation (Borrebaeck et al. 1993). Low amounts of N-glycolyl neuraminic acid (NeuGc)-terminated species were observed at m/z 1536.13 (2+), 1617.07 (2+), and 1698.25 (2+), which were assigned to the structures G1FNeuGc, G2FNeugc, and G3FNeuGc. In addition, small amounts of hybrid glycans were detected. Using β-galactosidase digestion of the heavy chain tryptic mixture, we determined the extent of mannose and galactose in each hybrid structure and assigned their overall structural composition. However, we could not determine the exact sugar linkages from our data. An overview of all observed glycoforms is provided in Table I.
Major glycan structures observed at the conserved N-glycosylation site of the anti-N-terminal mouse monoclonal antibody (clone 6E10)
| Calculated glycopeptide | ||||
|---|---|---|---|---|
| No | Observed iona, b | mass (Da) | Proposed glycan | Relative abundance |
| Complex-type glycans | ||||
| 1 | 1200.00a | 2397.97 | Man3GlcNAc2-FucGlcNAc | 0.091 |
| 2 | 1228.52a | 2454.99 | G0 | 0.197 |
| 3 | 1301.53a | 2601.05 | G0F | 1 |
| 4 | 1309.53a | 2617.04 | G1 | 0.051 |
| 5 | 1330.00a | 2658.07 | G0B | 0.015 |
| 6 | 1382.55a | 2763.10 | G1F | 0.561 |
| 7 | 1390.55a | 2779.0 | G2 | 0.012 |
| 8 | 1463.60a | 2925.16 | G2F | 0.084 |
| 9 | 1536.13a | 3070.19 | G1FNeuGc | 0.008 |
| 10 | 1544.60a | 3087.21 | G3F | 0.013 |
| 11 | 1617.07a | 3232.25 | G2FNeuGc | 0.006 |
| 12 | 1625.67a | 3249.26 | G4F | 0.008 |
| 13 | 1698.25a | 3394.30 | G3FNeuGc | 0.003 |
| Hybrid-type glycans | ||||
| 14 | 1362.06a | 2722.08 | Man3GlcNAc2Fuc-GlcNAcMan2 | 0.018 |
| 15 | 1370.05a | 2738.07 | Man3GlcNAc2-GlcNAcMan2Gal | 0.008 |
| 16 | 1426.57a | 2851.12 | Man3GlcNAc2Fuc-GlcNAcGalSA | 0.007 |
| 17 | 1443.07a | 2884.13 | Man3GlcNAc2Fuc-GlcNAcMan2Gal | 0.004 |
| 18 | 1451.09a | 2900.12 | Man3GlcNAc2-GlcNAcMan4 | 0.005 |
| 19 | 1686.33b | 5055.85 | Man3GlcNAc2Fuc-HexNAc3Hex12NeuGc | 0.003 |
| 20 | 1735.04b | 5201.91 | Man3GlcNAc2Fuc2-HexNAc3Hex12NeuGc | 0.010 |
| 21 | 1789.04b | 5363.96 | Man3GlcNAc2Fuc2-HexNAc3Hex13NeuGc | 0.011 |
| 22 | 1843.03b | 5526.02 | Man3GlcNAc2Fuc2-HexNAc3Hex14NeuGc | 0.005 |
aDoubly charged ions.
bTriply charged ions.
Interestingly, glycopeptides incorporating high-molecular-weight glycans on the same peptide backbone (EEQFNSTFR) were observed as triply charged species of m/z 1735.04, 1789.04, and 1843.03 (Figure 3B). This mass interval corresponds to a hexose unit. The MS/MS of the parent ion of m/z 1789.04 is shown in Figure 4. The fragments detected in the mass range 1100–1700 are doubly charged and they have m/z values identical to intact glycopeptides ions observed in the full scan mass spectrum (Figure 3A and B), confirming the identity of the peptide backbone. As described above, we could not derive complete carbohydrate structures because various monosaccharide compositions are possible for this observed mass. These putative structures were obtained using the GlycoMod software, designed to determine possible glycan compositions from experimentally determined glycan/glycopeptide masses (www.expasy.org/tools/glycomod). Based on the fragmentation pattern of the triply charged precursor a hybrid, biantennary structure (or of a higher degree of branching) is suggested from the observed MS/MS and is consistent with a sugar composition Hex13HexNAc3Fuc2NeuGc1-Man3GlcNAc2. This structure might result from abnormal processing of the precursor glycan of composition Glc3Man9GlcNAc2, which is attached to the Asn residue during protein biosynthesis. One antenna may be of the high mannose type and the second one may be elongated by the successive addition of GlcNAc and galactose.
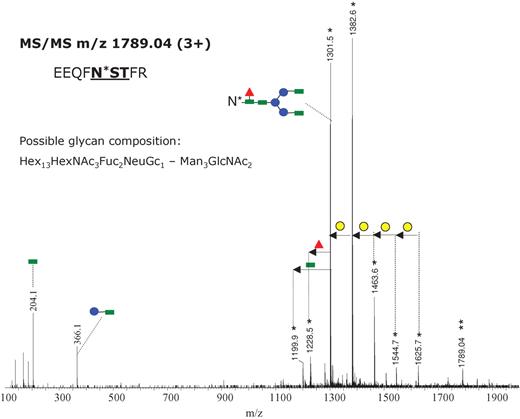
MS/MS the triply charged precursor ion of m/z 1789.04 obtained with a collision energy ramp from 30 to 40 V. The most abundant product ions are doubly charged (indicated with a single asterisk) and result from the fragmentation of the glycan moiety. The product ion of m/z 1301.5 (2+) (which provided the fragmentation pattern shown in Figure 2) indicates the same amino acid sequence for the peptide backbone. One of the possible glycan compositions is indicated at the left. The successive loss of hexose (either mannose or galactose) is indicated through yellow circles. Green square – N-acetylglucosamine; red triangle – fucose; blue circle – mannose; yellow circle – galactose; purple rhombus – sialic acid.
Glycosylation profile of the polyclonal anti-Aβ autoantibody
Intravenous immunoglobulin (IVIg), a purified IgG fraction from the blood of healthy individuals, is an FDA-approved therapeutic agent for immune and inflammatory diseases. IVIg contains Aβ autoantibodies which have been shown to exert a positive effect on AD patients. A phase 3 study evaluating safety and effectiveness of IVIg for the treatment of mild to moderate AD was recently initiated in December, 2008. For glycosylation studies, affinity isolation of Aβ autoantibodies from IVIg was performed using the Aβ (12–40) polypeptide, which contains the specific C-terminal epitope described above.
As described for the 6E10 antibody, glycopeptides were selectively detected in this mixture by monitoring the formation of the GlcNAc+ oxonium ion of m/z 204.1 in the parent ion detection mode (Figure 5A). In contrast to the mouse monoclonal antibody, a complex pattern is observed for the extracted ion chromatogram (EIC) of m/z 204.1 as a result of the polyclonal nature of the Aβ autoantibody. The glycopeptides typically elute early in chromatogram (15–20% acetonitrile), due to the polar character of the attached glycans. All four IgG subclasses were detected in the heavy chain tryptic mixture (Figure 5A) with IgG1 and IgG2 subclasses being observed with the highest abundance. Glycopeptides derived from IgG1 elute earlier than those of IgG4 and IgG2/IgG3, and within each subclass the neutral glycopeptides elute slightly earlier than the sialylated ones. Human IgG subclasses show more than 95% constant region sequence homology, but characteristic differences are found in the length of the hinge region, in the number of disulfide bridges, and also in the CH2 domain around the region of N-linked glycosylation. The tryptic glycopeptides of the Aβ autoantibody IgG1 contained the amino acid sequence EEQ296YNST300YR, while, for IgG2/IgG3, two simultaneous amino acid substitutions were found, Y296F and Y300F, respectively. The glycopeptides derived from IgG4 contain (compared to IgG1) a single amino acid replacement, Y296F (Wuhrer et al. 2007). These were observed as both doubly and triply protonated molecules in the full scan MS. In addition, these glycopeptides were found to contain uncleaved arginine and lysine residues, such as the amino acid sequence TKPREEQXNSTXR, where X denotes the amino acid mutations characteristic for each IgG subclass. For a rigorous, subclass-specific glycosylation analysis of the Aβ autoantibody, it was essential to ensure that the tryptic digestion of the antibody heavy chain proceeded to completion. This was based on the observation that miscleaved and fully processed glycopeptides from a specific subclass have distinct chromatographic elution times and may co-elute with glycopeptides from other subclasses, thus complicating their overall analysis.
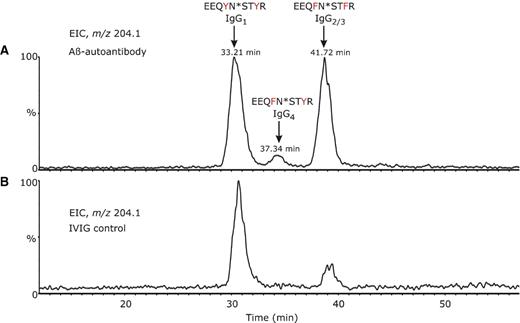
Extracted ion chromatogram (EIC) for m/z 204.1, corresponding to protonated GlcNAc+, over the chromatographic retention time 10–60 min for (A) β-amyloid autoantibody heavy chain tryptic digest and (B) IVIg heavy chain tryptic digest. The data were obtained using an MS-only acquisition. The distinct peaks in the chromatogram were assigned to distinct N-glycosylated peptide isoforms, corresponding to individual IgG subclasses found in the anti-Aβ autoantibodies and IVIg, as indicated above each peak.
The concentration of each immunoglobulin subclass in serum of healthy individuals depends on several factors, e.g., on the number of plasma cells producing that antibody type. Adults exhibit the highest concentrations of IgG1 (10–12 mg/mL), followed by IgG2 (2–6 mg/mL), IgA1, IgM, IgG3 (0.5–1 mg/mL), IgG4 (0.2–1 mg/mL), IgA2, IgD, and IgE (Shakib and Stanworth 1980; French 1986). The extracted ion chromatogram, EIC, of m/z 204.1, obtained for heavy chains tryptic digest of IVIg, is shown in Figure 5B and indicates that IgG1 is the most abundant subclass in this commercial product. For glycosylation analysis of the Aβ autoantibody, IVIg was chosen as a control, as this represented the starting material for the epitope-specific isolation of the Aβ autoantibody. Furthermore, it has been shown that autoantibodies may exhibit different constant region glycosylation profiles compared to total serum IgG (Wuhrer et al. 2008). Because IgG2 and IgG3 subclasses share identical amino acid sequences around the N-glycosylation site, it was not possible to separately analyze their glycosylation profile. However, the amount of IgG3 is considerably lower than IgG2 in human plasma. The EIC of m/z 204.1 (Figure 5A and B) indicates that the Aβ autoantibody contains elevated levels of IgG2/3 compared to IVIg. From the ion abundances of all glycopeptides observed in each individual subclass, the ratio IgG2/3/IgG1 for the Aβ autoantibody was determined to be approximately 1, while, for IVIg, the ratio IgG2/3/IgG1 was determined as 1/4. This semiquantitative estimation did not take into account differences in ionization efficiencies of distinct glycoforms and peptide isoforms. Interestingly, the levels of IgG4, although low, were found to be higher than those in total serum IgG. The observed levels of IgG4 in IVIg were found to be close to the limit of detection, and, therefore, no semiquantitative analysis of its abundance was performed.
The N-glycosylation profiles for each individual IgG subclass of the Aβ autoantibody are shown in Figure 6. Each mass spectrum was averaged and deconvoluted over the chromatographic elution time of the glycopeptides with the amino acid sequence EEQXNSTXR (where X = F or Y). The identities of the peptide isoforms derived from individual IgG subclasses and of their attached glycans were determined from MS/MS, acquired in the data-dependent mode, and from the experimental glycopeptides masses and theoretical mass values of the peptides without the sugar. However, MS/MS was essential to establish the correct glycan compositions, as accurate mass determination alone was not sufficient to discriminate between isobaric structures. For example, the amino acid substitution Y296F in IgG4 compared to IgG1 has a mass difference of 16, which is identical with the mass difference between fucose and hexose. Consequently, the deconvoluted mass of 3715.66, calculated for the observed ion of m/z 929.69 (4+), could have been assigned to either the “missed cleavage” glycopeptide from IgG4 (TKPREEQFNSTYR) containing the glycan G2FSA, or to the glycopeptide from IgG1 with a glycan G1F2SA. The MS/MS of this precursor ion (supplementary Figure) contains fragment ions: (i) 929.99 (2+), assigned to the peptide backbone derived from IgG4 which still has the first GlcNAc residue attached at Asn297 and (ii), 869.96 (2+) which corresponds to the same peptide backbone with a cross-ring cleavage in the first GlcNAc unit (denoted as 0,2X).
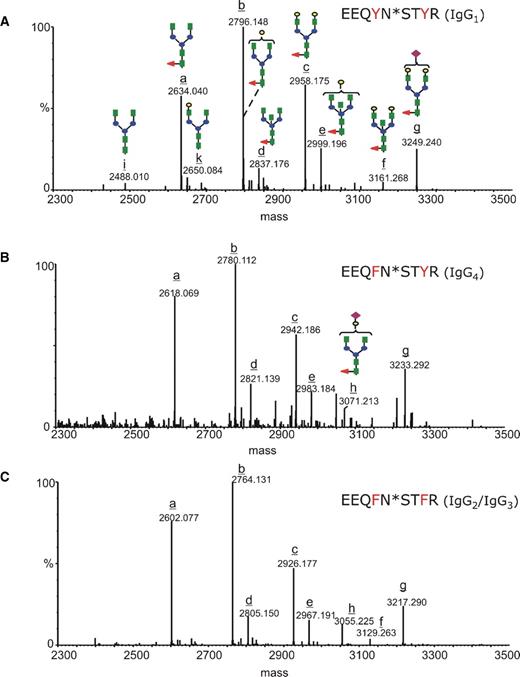
Deconvoluted mass spectra over the mass range 2300–3500, indicating the glycan populations determined for each IgG subclass: (A) EEQYNSTYR (IgG1), (B) EEQFNSTYR (IgG4), and (C) EEQFNSTFR (IgG2/3). The complex type glycans are represented with the following color code: green square – N-acetyl glucosamine; red triangle – fucose; blue circle – mannose; yellow circle – galactose; purple rhombus – sialic acid. The glycoforms are indicated with latin letters from a to k, and the structures corresponding to each glycan are represented in (A) and (B).
The glycans decorating the Aβ autoantibody constant region are almost entirely core fucosylated, and the most abundant glycoform in each IgG subclass is G1F, followed by G0F and G2F. In the case of IgG1, the digalactosyl and the agalactosyl structures have similar abundances (see Figure 6A), while for IgG2/3 and IgG4, the G0F population appears to be higher than the G2F (Figure 6B and C). The glycoforms containing bisecting GlcNAc (G0FB, G1FB, and G2FB) and sialic acid (G1FSA and G2FSA) were observed with lower abundance, while the glycoforms lacking the core fucose (G0, G1, and G2) were barely detectable. The subclass-specific glycosylation of the Aβ autoantibody compared to that of IVIg is presented in Figure 7 for the 11 most abundant glycoforms. Overall, the Aβ autoantibody contains lower levels of galactosylation, as G0F glycoform is elevated and G2F is decreased within each subclass compared to IVIg. No significant differences were observed among the remaining glycoforms for IgG1 and IgG2/3, respectively. Within the IgG4 subclass, the slightly elevated levels of G1 and G2 in IVIg compared to Aβ autoantibody may represent an artifact derived from the isobaric nature of the structures G2 and G1 in IgG4 with the structures G1F and G0F, respectively, in IgG1; because the glycopeptides from this subclass were hardly detectable in IVIg (see Figure 6B), we cannot exclude the possibility that the values determined for G1 and G2 may contain a contribution from the isobaric glycoforms from IgG1. The abundances determined for each individual glycoform relative to the abundance of G1F within each subclass are shown in Table II.
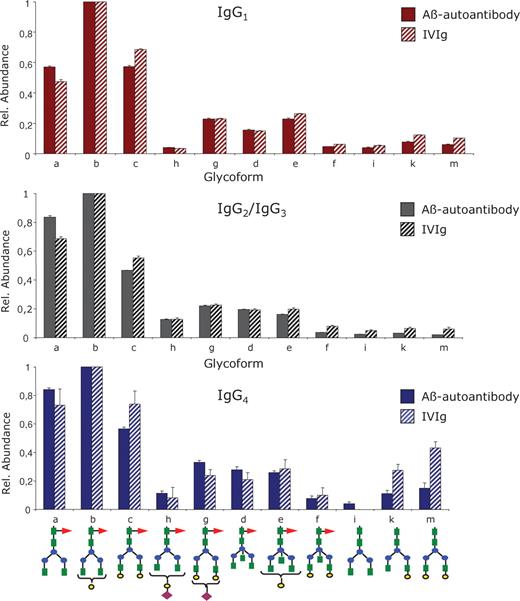
Differential, subclass-specific glycosylation profiling of the Aβ autoantibody constant region compared to IVIg: top – IgG1, middle – IgG2/IgG3, and bottom – IgG4. The profile for each IgG subclass was determined for the 11 most abundant glycoforms relative to the abundance of G0F glycoform within each subclass. The structure of each glycoform is depicted at the bottom; the one letter annotation is identical with that used in Figure 6 and Table II. Bar code: full bars – Aβ autoantibody; striped bars – IVIg.
Major glycoforms observed at the conserved N-glycosylation site of the Aβ autoantibody
| Glycoform | Glycan | Relative | |||
|---|---|---|---|---|---|
| Glycopeptide/subclass | assignmenta | [M+H]+exp.(Da)b | [M+H]+calc.(Da) | composition | abundancec |
| EEQYNSTYR (IgG1) | i | 2488.010 | 2487.988 | G0 | 0.04 |
| a | 2634.040 | 2634.046 | G0F | 0.57 | |
| k | 2650.084 | 2650.041 | G1 | 0.08 | |
| b | 2796.148 | 2796.099 | G1F | 1 | |
| m | 2812.124 | 2812.094 | G2 | 0.06 | |
| d | 2837.176 | 2837.125 | G0FB | 0.16 | |
| c | 2958.175 | 2958.152 | G2F | 0.57 | |
| e | 2999.196 | 2999.178 | G1FB | 0.23 | |
| h | 3087.220 | 3087.194 | G1FSA | 0.04 | |
| f | 3161.268 | 3161.231 | G2FB | 0.05 | |
| g | 3249.240 | 3249.247 | G2FSA | 0.23 | |
| EEQ(Y/F)NST(F/Y)R (IgG4) | i | 2472.011 | 2471.993 | G0 | 0.04 |
| a | 2618.069 | 2618.051 | G0F | 0.84 | |
| k | 2634.058 | 2634.046 | G1 | 0.11 | |
| b | 2780.112 | 2780.104 | G1F | 1 | |
| m | 2796.166 | 2796.099 | G2 | 0.15 | |
| d | 2821.139 | 2821.130 | G0FB | 0.28 | |
| c | 2942.186 | 2942.157 | G2F | 0.57 | |
| e | 2983.184 | 2983.183 | G1FB | 0.26 | |
| h | 3071.213 | 3071.199 | G1FSA | 0.11 | |
| f | 3145.262 | 3145.236 | G2FB | 0.08 | |
| g | 3233.292 | 3233.252 | G2FSA | 0.33 | |
| EEQFNSTFR (IgG2/IgG3) | i | 2456.062 | 2455.998 | G0 | 0.02 |
| a | 2602.077 | 2602.056 | G0F | 0.83 | |
| k | 2618.074 | 2618.051 | G1 | 0.03 | |
| b | 2764.131 | 2764.109 | G1F | 1 | |
| m | 2780.090 | 2780.104 | G2 | 0.02 | |
| d | 2805.150 | 2805.135 | G0FB | 0.20 | |
| c | 2926.177 | 2926.162 | G2F | 0.48 | |
| e | 2967.191 | 2967.188 | G1FB | 0.16 | |
| h | 3055.225 | 3055.204 | G1FSA | 0.13 | |
| f | 3129.263 | 3129.241 | G2FB | 0.04 | |
| g | 3217.290 | 3217.257 | G2FSA | 0.22 |
bThe experimental [M+H]+ values of the glycopeptides were determined based on the observed [M+4H]4+ glycopeptide ions, as follows: two consecutive MS scans were summed and smoothed using the Savitzky Golay algorithm (feature available in the MassLynx 4.1 software) and subsequently centered, with the centroid set at 80% height of the C12-monoisotopic peak.
cThe relative abundance of each glycoform was determined as the ratio of the observed ion abundance for each individual glycoform to that observed for the glycoform G0F within each IgG subclass. The ion abundances for all observed charge states for a particular glycopeptide were considered.
Conclusions
Glycosylation analysis of epitope-specific anti-Aβ antibodies provided a detailed picture of the glycans attached at the conserved N-linked position on the heavy chain. Moreover, analysis of glycopeptides has advantages over conventional carbohydrate analysis, revealing the specific glycoform microheterogeneities of the individual IgG subclasses and a semiquantitative estimation of their distribution in the Aβ-autoantibody. This finding may be important because of the specific effector functions of each IgG subclass. IgG1 represents the primary secretory product of the adaptive immune system and it is specific for protein antigens, while IgG2 is secreted in response to stimulation with carbohydrate antigens, e.g., the polysaccharides of the bacterial cell walls (Jefferis 2007). A deficit or increase in selected IgG subclasses may have relevance for the activity of the Aβ antibody. Our results indicate that the Aβ autoantibody contains approximately four times more IgG2 compared to IVIg. IgG4 is the less abundant IgG subclass in human plasma (Shakib and Stanworth 1980; French 1986), and these antibodies become prominent only after prolonged immunization with protein antigens (Aalberse and Schuurman 2002). It would be interesting to probe whether increased levels of IgG2 and/or IgG4 correlate with a possible pathophysiologic role of amyloid-β autoantibodies.
It is widely accepted that the antibody effector functions are dependent on appropriate glycosylation of the constant region. In the mouse IgG, the nongalactosylated species represents the most abundant glycan population, followed by mono- and digalactosyl glycoforms. This pattern is common for other recombinant antibodies (Sullivan et al. 2004). In humans, a high level of nongalactosylated species is characteristic of autoimmune disorders such as rheumatoid arthritis. A possible explanation for this is that the uncovered GlcNAc residues attached to the core pentasaccharide in combination with backbone protein motifs could reveal novel antigenic determinants which are normally masked by galactose (Parekh et al. 1985). In vitro studies demonstrated 2-fold reduced levels of complement lysis activity of recombinant antibodies having reduced levels of galactosylation (Boyd et al. 1995; Hodoniczky et al. 2005). The Aβ autoantibody shows slightly decreased galactosylation compared to IVIg, a feature which is in contrast to its protective nature. Unlike the human Aβ autoantibody, the mouse IgG contains some tri- and tetragalactosylated species, with immunogenic potential (Galili 1993), as well as low abundance hybrid structures that enhance the molecular microheterogeneity. The Aβ autoantibody contains significant amounts of bisecting GlcNAc and terminal N-acetyl neuraminic acid on fully core fucosylated structures. It has been reported that fully fucosylated IgG1 shows a 50-fold decrease in receptor binding affinity compared to the nonfucosylated antibody and a 100-fold decrease in antibody-dependent cellular cytotoxicity (Shields et al. 2002; Shinkawa et al. 2003; Yamane-Ohnuki et al. 2004). A recent study demonstrated that highly sialylated antibodies exhibit anti-inflammatory properties derived from reduced binding to the FcγRIIIa receptor and altered antigen binding (Kaneko et al. 2006; Scallon et al. 2007), which were explained by the lower flexibility of the hinge region induced by the presence of neuraminic acid.
In conclusion, investigation of immunoglobulin glycosylation by mass spectrometry represents a highly sensitive method for elucidation of subclass-specific glycan populations and for probing the structural integrity of potential therapeutic candidates. Because immune therapy has received considerable attention in the last years for both treatment and prevention of AD and the molecular mechanisms of AD and the protective role exhibited by β-amyloid autoantibodies are poorly understood, the molecular characterization of glycosylation of these antibodies represents a new approach to extend our understanding for their physiological role.
Material and methods
Materials
A mouse anti-β-amyloid monoclonal antibody (mAb1560, clone 6E10) was purchased from Millipore (Billerica, MA). IVIg was purchased from Bayer Vital GmbH (Leverkusen, Germany) and from Calbiochem (San Diego, CA). The Micro BCATM quantification kit was obtained from Pierce Perbio (Bonn, Germany). Dithiothreitol, iodoacetamide, ammonium bicarbonate, and 96% formic acid were purchased from Sigma-Aldrich (St. Louis, MO). Sequencing grade-modified porcine trypsin was obtained from Promega (Madison, WI). NuPage 4–12% Bis-Tris pre-cast gels, sample and running buffers, and Coomassie SimplyBlue were from Invitrogen (Carlsbad, CA). Acetonitrile was purchased from Caledon Laboratories, Ltd. (Georgetown, Ontario). Purified water (17.8 MΩ) was obtained from an in-house Hydro Picopure 2 system. All chemicals were used without further purification unless otherwise specified.
Methods
Epitope-specific isolation of Aβ-autoantibodies. The affinity column containing immobilized Cys-Aβ (12–40) was prepared as follows: 3.7 mg of synthetic Cys-Aβ (12–40) peptide was dissolved in a 10 mL coupling solution containing 50 mM Tris-HCl, 5 mM EDTA (pH 8.5) to a final concentration of 0.37 mg/mL. This solution was added to 1 mL of Ultralink Iodoacetyl gel dried of liquid, and the coupling reaction was allowed to take place for 1 h at room temperature under shaking, followed by 30 min standing without shaking. The matrix was loaded onto a 2.5 mL column, which allows the liquid to be drained. The column was washed with a 3 mL coupling solution. The nonreacted iodoacetyl groups were blocked with a 1 mL blocking solution containing 50 mM of l-cysteine-HCl dissolved in the coupling solution, for 45 min at room temperature. This procedure was repeated twice. Subsequently, the column was washed with 5 mL of 1M NaCl, followed by 5 mL of PBS buffer (pH 7.2) and then stored at 4°C.
Affinity isolation of anti-Aβ autoantibodies from IVIg was performed as follows: 0.5 mL of Cys-Aβ (12–40) containing matrix was loaded onto a 2.5 mL column and washed with a 20 mL PBS buffer (pH 7.2). The matrix was then transferred into a 15 mL flask using a 5 mL PBS buffer and mixed with 5 mL IVIg. The suspension was spun overnight at 4°C, and then transferred back onto the column and washed eight times with each 10 mL PBS and subsequently two times with each 10 mL MilliQ. The affinity-isolated Aβ autoantibody fraction was eluted 10 times with each 0.5 mL 0.1% trifluoroacetic acid. The quantification of the eluted antibody fractions was performed using the Micro BCATM kit, and the detection was performed at 562 nm using a Wallac ELISA plate reader. The antibody fractions were lyophilized to dryness.
SDS–PAGE. Gel electrophoretic separation of reduced and alkylated anti-Aβ autoantibodies or IVIg was performed on 4–12% Bis-Tris pre-cast gels as follows: the lyophilized antibody was incubated for 1 h at 90°C with a 20 μL sample buffer containing 100 mM dithiothreitol. A solution of iodoacetamide in water was added to the mixture in a molar ratio DTT/IAA 1:3, and the reaction was continued for an additional hour at room temperature. The reduced and alkylated antibody was loaded onto the gel (approximately 10 μg/lane). The bands were stained overnight with Coomasie brilliant blue.
In-gel digestion. The protein bands corresponding to antibody heavy chains were manually cut and digested with trypsin for 8 h at 37°C in an automated fashion with a Progest robotic digester (Genomic Solutions). Samples were lyophilized to dryness. In order to ensure complete enzymatic degradation of the heavy chain, the lyophilized mixture was redisolved in 30 μL of 25 mM ammonium bicarbonate (pH 7.4) containing 0.033 μg/μL trypsin and incubated overnight at 37°C.
NanoLC-ESI-QTOF-MS: LC/MS was performed on a Waters-Micromass Q-Tof Premier mass spectrometer equipped with a nanoAcquity UPLC system (Waters, Milford, MA). Analyses were performed on a 3 μm, 100 μm × 100 mm, Atlantis dC18 column (Waters, nanoAcquity), using a flow rate of 300 nL/min. A C18 trapping column (180 μm × 20 mm) with 5 μm particle size (Waters, nanoAcquity) was positioned inline with the analytical column and upstream of a micro-tee union used both as a vent for trapping and as a liquid junction. Trapping was performed for 3 min at a 5 μL/min flow rate, using the initial solvent composition. Briefly, a 4 μL aliquot of the digest sample was injected onto the column. Peptides were eluted by using a linear gradient from 98% solvent A (0.1% formic acid in water (v/v)) and 2% solvent B (0.1% formic acid in acetonitrile (v/v)) to 40% solvent B over 90 min. Mass spectrometer settings for the MS analysis were: capillary voltage of 3.2 kV, cone voltage of 20 V, collision energy of 5.0 V, and source temperature of 80°C. The mass spectra were acquired over the mass range 200–2000 Da. A capillary voltage of 3.2 kV and a cone voltage of 20 V were used for glycopeptides analysis, in order to prevent their insource decomposition. For subclass-specific glycosylation analysis, the instrument was operated in the MS only mode. Three distinct isolation batches of Aβ autoantibody were analyzed, and, for each batch, technical triplicates were acquired in the MS only mode. MS/MS data were acquired in the data-dependent mode, using collision energies based on mass and charge state of the candidate ions. Alternatively, a collision energy ramp from 30 V to 40 V was found to be optimal for the MS/MS analysis of glycopeptides. For calibration, an external lock mass was used with a separate reference spray (LockSpray) using a solution of Glu-Fibrinogen peptide (300 fmol/μL) in water/acetonitrile 80:20 (v/v) and 0.1% formic acid, with a mass of 785.8496 (2+).
Data analysis was performed using MassLynx 4.1 software. For subclass-specific glycosylation analysis, data from three isolation batches of Aβ autoantibody were averaged, and the mean and standard deviation were calculated for each glycoform of each subclass using nine separate experimentally determined ion abundances (3 separation batches × 3 analysis/antibody batch). All observed charge states for a particular glycopeptide were included in these analyses. Subclass-specific glycosylation analysis was performed by averaging the MS scans over the chromatographic retention time in which glycopeptides from a specific subclass eluted. The relative abundance for each glycoform was determined by dividing the determined ion abundance for a particular glycopeptide to the ion abundance of the G1F glycoform within each IgG subclass. In addition, for glycosylation analysis of the 6E10 mouse antibody, the software GlycoMod (www.expasy.org/tools/glycomod) was used to determine putative glycan compositions from MS data.
Funding
The Intramural Research Program of the NIH; National Institute of Environmental Health Sciences; The Deutsche Forschungsgemeinschaft, Bonn; and the University of Konstanz, Germany.
Conflict of interest statement
None declared.
Abbreviations
- AD
Alzheimer's disease
- β-APP
β-amyloid precursor protein
- CSF
cerebrospinal fluid
- EIC
extracted ion chromatograms
- PID
parent ion detection method
